
The always-popular La Jolla Shores beaches have been particularly packed this summer, as beachgoers enjoy notably warm waters.
Southern California is famous for its endlessly sunny beaches and surfable waves, but this summer, even natives of the Land of Sunshine have noticed something unusual: ocean temperatures have been exceptionally warm over the past few weeks. While this means that nearly everyone is jumping in the water sans wetsuits, many people are wondering how this year stacks up to previous years, and what is causing such warm oceans.
The Hunt for Red July
According to both satellite SST measurements and in situ buoys that measure the ocean at depth, the waters off California and Oregon have warmed nearly 5oC in some places since the beginning of July. Warm events have also been creeping farther north than usual, bringing comparatively warm 16oC waters almost to the northern border of California.
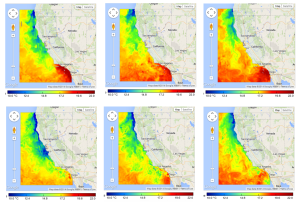
Follow the rainbow – Ocean temperature at 0 meters (top row) and 20 m (bottom row) off California for July 8, July 18 and Aug. 8, 2014 (left to right). Data are from the 3 km Regional Ocean Modeling System (ROMS) produced by Dr. Yi Chao at UCLA, and available through SCCOOS. The NOAA SWFSC notes that an especially warm SST period occurred from July 15-23, visible by the northward movements of red-orange areas.
In terms of causes, the National Oceanic and Atmospheric Administration’s Southwest Fisheries Science Center (NOAA SWFSC) suggests that the warm events may be related to weakening northwesterly summer winds, which usually push surface waters offshore, driving upwelling of deeper, cold waters. If the winds weaken, warm surface waters remain right offshore, even moving northward along the coast.
While beachgoers are jumping into California’s balmy surf with extra zeal, observations of this summer’s warm oceans beg an obvious follow-up question: how does 2014 compare to previous years? Fortunately, the Southern California Coastal Ocean Observing System (SCCOOS), along with the other West Coast Ocean Observing System Regional Associations (CeNCOOS, NANOOS and AOOS), was created in order to track exactly these ocean phenomena. And although SCCOOS is only 10 years old, the Scripps Institution of Oceanography has been tracking water temperatures for almost 100 years at locations along the California coast, providing long-term datasets that allow us to analyze temperature trends.
Long-term advantages
Water temperature is one of the most easily and frequently measured properties of the ocean, and doesn’t require a scientific degree to detect. Anyone who dips a handheld thermometer or their hand into the water can form their own opinions about “warm” and “cold”. But determining whether the water temperature is actually different from last summer’s sand-filled memories requires a rigorous and systematic record of ocean temperatures.
Manual sea surface temperature measurements exist from as far back as 1917 for the Scripps Pier, 1924 for the Newport Beach Pier, and the 1950s for several other piers along the Southern California Bight. Back then, automated temperature sensors didn’t exist, so measuring water temperature used to require a fair amount of manual labor – someone would have to go out every day, at roughly the same time, and drop a bucket off the end of the pier to capture a water sample, then haul the bucket up and stick a thermometer in. Even more impressive is the fact that, over the past 97 years (in the case of the Scripps Pier), nearly every day from every year has a temperature measurement, producing a record as robust as an automated temperature-measuring system can.
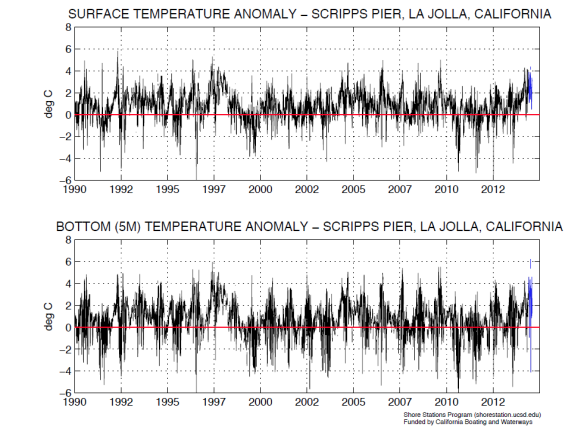
Daily surface and bottom temperature anomaly from the Scripps Pier Manual Shore Station, La Jolla, California. Anomalies are produced by subtracting the long-term harmonic mean (1916-2001) from the daily temperature (a positive anomaly indicates that temperatures are warmer than average). Temperature data from June 1 to August 5, 2014 (shown in blue) are preliminary and unverified (Data collection by the Shore Stations Program at SIO, funded by CA Dept. of Parks and Recreation, Division of Boating and Waterways; graphs produced by Melissa Carter of the SSP).
Thanks to the development of modern equipment, SCCOOS now also has several automated means of measuring ocean temperatures around the Southern California Bight, both inshore and offshore. In addition to the Manual Shore Stations program, which is still in use today, SCCOOS has also implemented a network of Automated Shore Station sensors, attached to piers at Scripps, Newport, Santa Monica and Santa Barbara. Farther offshore, the Coastal Data Information Program (CDIP) wave buoys provide point-source temperature data along with wave-tracking information.
Additionally, the SCCOOS/SIO Instrument Development Group (IDG) Spray Glider Program, supported by the NOAA Ocean Climate Observation Program, runs several continuous glider lines off California, providing depth profiles of water temperature along consistent geographic tracks. All of these systems mean that the ocean off California is being consistently measured, giving us a comprehensive picture of changing coastal ocean conditions.
Cause and effect?
In addition to its own relevance to marine users, ocean temperature, and especially sea surface temperature (SST), is an important indicator of a suite of current and changing ocean conditions. One example is larger-scale, longer-cycle ocean phenomena, such as El Niño/La Niña events. While those anxious about California’s multi-year drought (which should be everyone) are attuned to the buzz about a much-hoped-for El Niño this fall, it’s too soon to say whether, and how, this summer’s warm oceans might be related to a possible El Niño. Although El Niño events do bring anomalously warm waters to the California Current System, the process involves additional factors in other regions of the Pacific (for more information on El Niño, check out these explanations from SCCOOS and NOAA).
Warmer oceans appear to be influencing the biology of the region, too. Recently, beachgoers all along California have noticed thousands of by-the-wind sailors, or Velella velella, washing up at the high-tide line. These transparent-blue jellyfish-like creatures, which look like sand-wrung plastic bags, float along the ocean surface at the mercy of the currents and winds. They are usually found in the warmer waters off Baja California, so scientists speculate that they may be floating north along with the warm intrusions that have been washing the California coast this summer.

By-the-wind-sailor (Velella velella) is a small jellyfish-like organism whose movement is directed by the winds and ocean currents. In the past few weeks, thousands of these creatures have washed up along California’s shores over the past few weeks. Although no one is sure why, scientists speculate that Velella may be moving north with California’s recent warm water intrusions.
Fishermen who frequent Southern California’s piers have also been reaping the benefits of large schools of tropical fish temporarily moving north and inshore. Right now, you don’t need a boat to catch a yellowfin tuna – just drop a line in the water off the Ocean Beach Pier, and something is bound to bite. NOAA SWFSC’s annual salmon trawls off Tomales Bay have also noticed ocean sunfish (Mola mola) and sea nettles (Chrysaora fuscescens) closer to shore and farther north than they are typically found.
Thermal causes and effects and future predictions, while endlessly entertaining to speculate on, are still uncertain (even SCCOOS, for all its wizardry with ocean measurements, cannot make definite long-term predictions). But if you’re eyeing the surf and considering leaving work early to hit your board, rest assured that you’ll have a warm ride on the waves. And while you’re out there, stick a thermometer in the water and make a note of the number. When it comes to the oceans, we need al the monitoring we can get.


